This is a guest post by Matthew Heusser.
Today I’ll be talking about Browser tricks – little features you might not even realize exist, mostly in the “developer tools” sections of the browser. These aren’t about code, but instead ways to make testing a little easier.
1. Responsive Design Mode
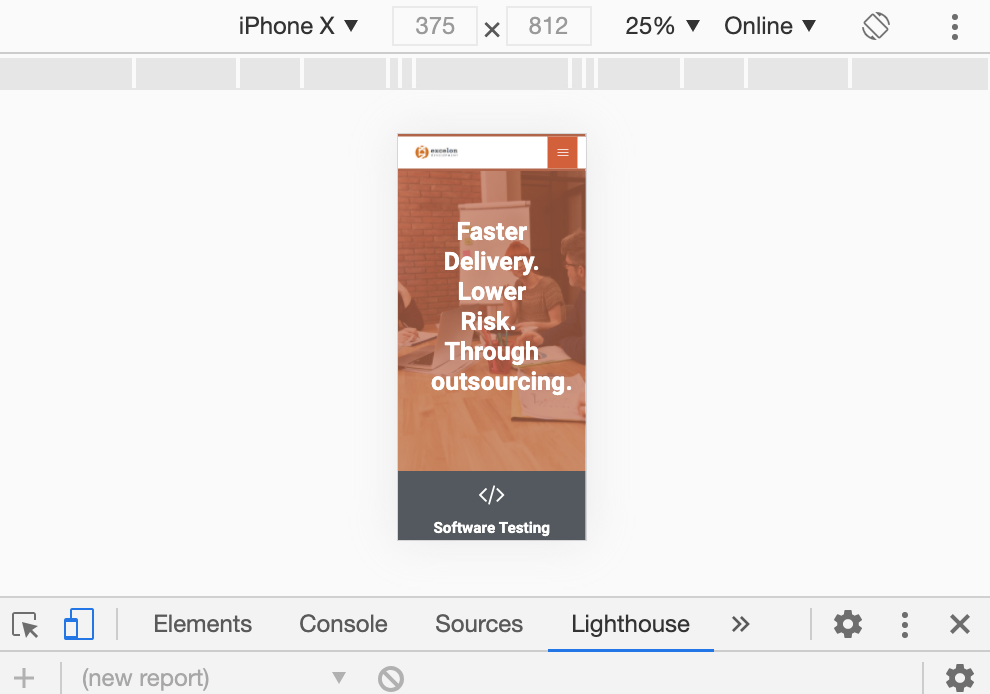
Sometimes you want to see how a web page will appear on a phone. Firefox and Chrome box have simple, easy, lightweight phone simulators built-in. In Firefox, it is Tools->Web Developer->Responsive Design Mode, while in Chrome it is View->Developer tools, followed by clicking the device toolbar – that looks like a picture of the mobile device next to a full-size screen. Once you click, you’ll see how chrome believes the website will appear on the device. As the saying goes, “there’s nothing like the real thing baby”, and that still holds — yet browsers are getting better and better at creating accurate renderings.

2. Edit the web page itself
If you find a front-end bug, you might be able to edit the HTML right then and there and see if it fixes the bug. Here’s how:
Reverting back to a full page, you can scroll to the bottom, to get to the copy button. From there right-click and click “Inspect.” That highlights a bit of HTML that is the button. To the left, there are three dots, click those and a menu appears that includes “edit as HTML”; you can then edit the elements themselves. When you press ENTER or RETURN, the web page changes.
This means you can do more than just find bugs, but instead actually propose the fixes. Do that, and suddenly testing is a fully participating part of the development team.
3. Take this web page offline
Sometimes you want to test what happens when the user loses their internet connection. Do this with the entire laptop by turning off WiFi and a bunch of applications may wig out. Instead, go into developer tools and click the gear icon on the right, then click the Run command. You’ll see another hundred commands you can run, including Network toward the bottom, which has Go online and Go offline commands.
4. Javascript Console
You can run any javascript command in the console, and it will run in the context of the web page. In developer tools, you can view the console, seeing all the Javascript warnings on the page. You can also type a command into the browser. So, for example, when you type:
console.log(3 / 2);
The number 1.5 appears in the console window!
Once you start to study Javascript you can manipulate the Document Object Model (DOM) or call any JavaScript function. This can be a quick way to call MicroServices in an environment that already has authentication done.
5. Change where you save files
In Firefox, under preferences, you can see where the downloads are. If you’re anything like me, you might save dozens of files every day. Putting them directly on your desktop will save you two clicks. That’s fifty clicks a day, perhaps a minute or two a week. You could spend that time reading blog posts without the guilt.

6. Watch how your page loads
If you are concerned about how quickly your page loads, it might be good to know if the load is progressive, with buttons that work and some text, all-or-nothing, or nonsensically. To do this, try the performance tab. Click the circle arrow, which is “Start profiling and reload the page.” Make sure screenshots are checked in the checkbox. You’ll load a network waterfall diagram that shows what files are loading, but also images for what the page looks like in the browser every 500 milliseconds. Mouse over the images to see what they look like.

7. Get a free front-end performance report
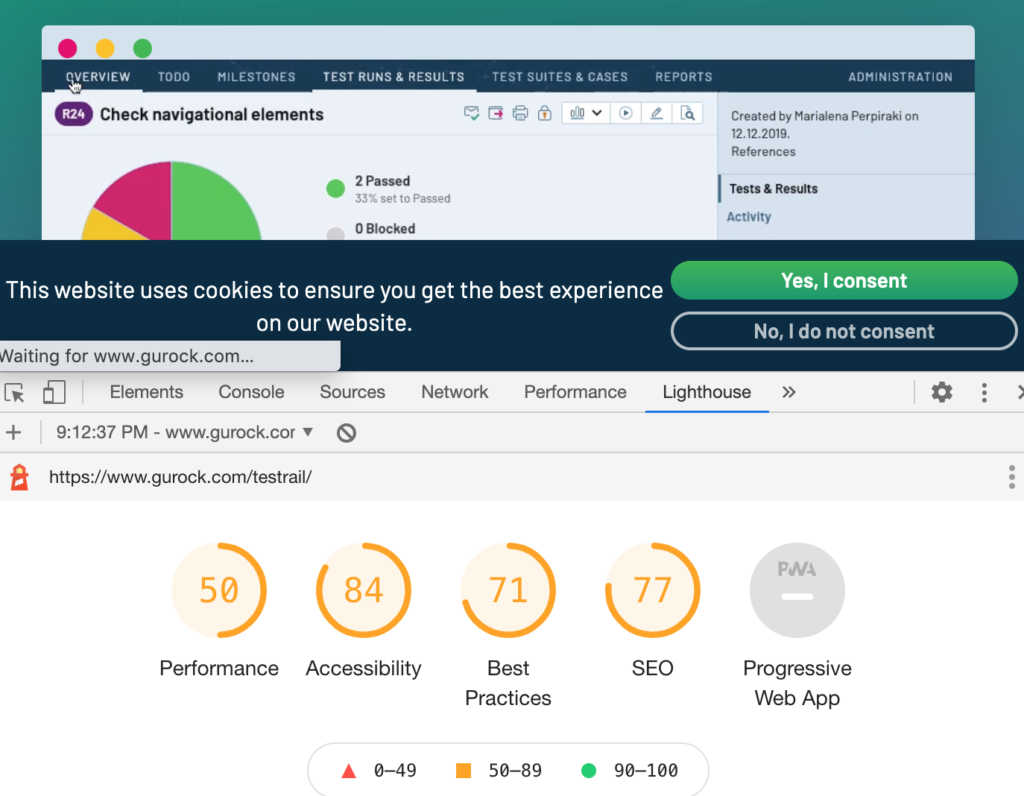
You can rate each web page on performance, accessibility, best practices, SEO, and how it adds features based on screen size, all for free, built into Google Chrome. That is as simple as going to Developer tools and clicking the “Lighthouse” tab. Scroll down to learn details about your score — and how to improve it!

That’s it. Seven tricks to speed up your testing and add value, perhaps value no one expected, with just a few clicks of the mouse.
The problem with Chrome and Firefox isn’t the lack of these tools, it is that there are too many – there are so many tools that it is hard to research and find the few truly powerful tricks you’ll use frequently.
What are your favorites? Please leave your ideas in the comments.


