This is a guest post by Nishi Grover Garg.
Agile teams are constantly running toward goals, requiring constant planning, monitoring, and replanning. Metrics can help support these efforts by providing useful information about the health and progress of the project.
There are a few common metrics we use in agile teams: sprint burndown charts, release burnup charts, team velocity. They’re common because they communicate practical information, but they’re not the only metrics we can employ.
Here are three metrics you can easily create that will be very useful for your agile team.
![]()
Defect Health
The number of defects may not be a good metric for any team, agile or otherwise. Counting the number of defects found, appraising or critiquing people’s work based on defect counts, or thinking of product quality in terms of defect counts may lead us to impending doom. But what can really help is keeping track of the health of defects in your system.
We can create charts answering some important questions about the defects:
- How quickly are the defects found getting resolved (what’s the turnaround time)?
- How often do the defects get rejected (for reasons such as Works as Designed, Cannot Reproduce, Duplicate, etc.)?
- How many defects are not triaged and have no fix date (meaning defects are getting postponed for too long)?

All of these factors are easily tracked using normal filters in a defect tracking tool. As a result of these defect health metrics, the team will have a lot of information about what is going on within the system as well as within their team. Instead of turning into a people management metric, this information will work as a powerful tool in keeping the team aligned on their path to quality with actionable items for every digression.
Test Progress
The best way to gauge the progress of the project as a whole would be to look at the testing progress.
To mark the progress in a tight manner, we would need to create a good test plan at the beginning of the release or sprint. Marking activities as completed, in progress or pending against this plan would give us a more accurate indicator of progress than superficial indicators like the number of tests created, executed, or passed or failed.
You can also use a percentage instead of numbers for tasks performed vs. planned. The visual indicator may take us deeper into the team’s working and drill down into reasons for delays (if any).
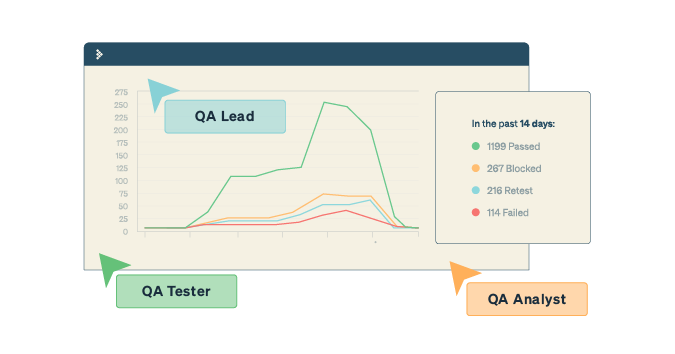
Let’s say the sprint started on Monday, Aug. 1. In the week of Aug. 1 to 5, there were more tests created than executed, which is understandable, as the beginning of the sprint would have fewer things to test. On Aug. 5 the first build was ready for testing, and the week following saw tests being executed, defects being raised in higher numbers, and defects being fixed in parallel, which was great.
The week following that, though, we find that the number of defects being fixed declined, and so did the test progress.

On analysis of this situation, we could find any of the following reasons:
- The developer’s focus shifted to development of the next user stories
- The testers began working on designing more tests, and retesting and regression was planned for later
- There was a holiday in the week, and many people had taken off additional days, so the team may have been short-staffed
Whatever may be the underlying reason, the metric did give us a fair insight into the team’s work and a way to analyze their day-to-day activities. The situation may not be alarming here, and the conditions may correct as soon as the focus comes back to testing tasks — or as soon as the people return from their time off. If there is a reason to worry, the metric will help us realize it and keep on track!
Build Failures
This metric makes sense in a DevOps or continuous integration sort of environment, where we integrate our work often and build periodically. Though the frequency of running these builds may be context-dependent, what matters the most here is the number of times the auto-run build failed to compile or build.
Most of these failures will be attributed to incomplete or bad checkins of code, dependencies being missed, or automated tests failing because of changes or defects. Whatever the reason for these failures, they will cause the team to spend time analyzing and fixing the failure and making the build pass.
Since that can be a massive effort, triggering multiple email conversations and alarm, keeping a track of how much extra effort is being spent in these unintended activities can be useful.

How many times you build per hour or day may be very different for different teams, so the number here may not be as relevant as the relativity of it over time. If the number of build failures is reducing sprint over sprint, then we know our work is getting better.
Ways to improve this metric would be to educate the developers on when and how the build is triggered, establishing a common place to update their dependencies, keeping a handy checklist of things to ensure before the build is triggered, and having one owner for the build process who tracks down the failure and has the relevant person correct the code. As we see in the graph above, the team has definitely shown improvement in their build failures per sprint over the course of four sprints!
I hope these three metrics you may not have considered before prove useful for your agile team on journey to quality software.
![]()
Nishi is a corporate trainer, an agile enthusiast and a tester at heart! With 11+ years of industry experience, she currently works with Sahi Pro as an Evangelist and Trainings Head. She is passionate about training, organizing testing community events and meetups, and has been a speaker at numerous testing events and conferences. Check out her blog where she writes about the latest topics in Agile and Testing domains.